Contributors to this chapter: Johan Miörner & Jonas Heiberg
This chapter introduces how to transform the two-mode weighted data matrix from NVivo and elaborates on different potential outputs and their applications. This is followed by a practical step-by-step guide for installing and running the relevant scripts in R. All scripts referred to in this chapter can be found in the file repository.
Prerequisites: Installation of R and RStudio. For free downloads: download R and download RStudio.
Transforming the output from NVivo
Note: all scripts are available in the file repository located under Resources.
As described in the introduction, associations or similarities between actors and concepts can be represented in different types of network graphs in STCA. Two-mode networks are the most direct representation of the data, where actors and concepts are presented as directly linked nodes in network visualizations, indicating which actors used which concepts. This relational information can be further condensed into so-called one-mode networks, where actors are linked to actors based on their use of the same concepts, or where concepts are linked to concepts by being used by the same actors (see Fig. 2 in the introduction).
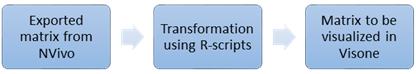
The direct output provided by the Matrix Coding Query in NVivo is a two-mode network, with mapped- and associating variables on the y- and x-axes. Each cell contains a value representing the number of times an actor has a link to a concept (either in total, or corresponding to the number of documents in which the actor has used the concept, depending on the ‘files coded’ option during export, see Chapter 3). This network can be visualized directly in Visone as a two-mode network where the strength of links between nodes (thickness of edges, see Chapter 6) correspond to the values in the cells. For many STCA applications, however, we are interested in transforming the direct output from NVivo before visualizing the network in Visone (Fig. 1). For this purpose, we have developed a set of R-scripts that transform the exported matrix from NVivo into a matrix which corresponds to the desired output to be visualized in Visone. In the following, we will discuss the core features of the scripts and outline a set of typical desired outputs for different STCA-applications.
Key transformations
First, we might want to convert the values in cells of a two-mode data matrix to binary relationships. For many STCA-applications, we assume that it is sufficient to know whether an actor either endorsed a specific concept or not, instead of how many times this has happened across the different text documents. If we understand concepts as referring to regulative, normative or cognitive institutions that an actor subscribes to, we can assume that statements often function as rationalizations, justifications or valuations for specific actions or preferences. We will be often interested in whether or not two concepts have been associated by a specific actor in the collection of texts. How many times these concepts were mentioned by this same actor, will depend on the specific setup structure of the documents. Therefore, how often this happens is less important in the standard STCA application. This is achieved by converting the weighted matrix (with cell values corresponding to the number of occurrences) to an unweighted one, replacing any value > 1 with 1.
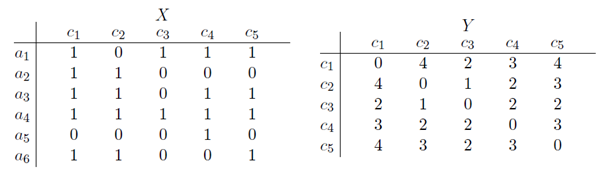
Second, we are often more interested in the one-mode projection rather than the two-mode network. One-mode projections allow us to visualize actor- and concept congruence networks separately, i.e. how actors are close or distant to other actors by referring to the same concepts and how concepts are related to each other by how often they are co-mentioned by the different actors. One-mode concept networks will thus reveal configurations of concepts that provide coherent rationales for actions, while one-mode actor networks will reveal how actors are similar in terms of rationalities based on the joint framing of concepts. Transforming a data matrix from a two-mode to a one-mode projection involves counting how many actors have mentioned a concept-pair and vice versa. From a two-mode data matrix it is thus possible to produce a concept congruence network which is a one-mode network depicting how many actors have used a pair of concepts. This is depicted in Fig. 2, where the matrix X is a two-mode data matrix with the weights converted to binary relationships, and matrix Y is a one-mode concept congruence matrix where the cell values correspond to how many actors have used each concept pair together. For example, concept 2 (C2) and concept 4 (C4) has been mentioned together by 2 actors. Vice versa, a two-mode matrix can be transformed to an actor congruence network where the cell values correspond to the number of concepts a pair of actor have both referred to.
Third, it is often useful to normalize the similarity between different concepts or actors to a weight between 0 and 1 because we are interested in the association of two concepts across all actors irrespective of the number of times it has been mentioned in the text.
For current STCA applications, we have used Jaccard normalization. The Jaccard similarity in a concept congruence network is essentially expressing the relative overlap between two concepts, calculated by the number of actors having co-mentioned the two concepts divided by the number of times the concepts have been mentioned individually or conjointly by all the actors. This results in a measure of 0 in case the two concepts have never been mentioned conjointly by any actor, and 1 in cases where the two concepts were always co-mentioned or not mentioned at all. Measures in between 0 and 1 indicate how strongly the two concepts have been associated by the different actors in the texts analysed.
It is however perceivable that one wants to normalize a one-mode data matrix, which is based on a two-mode matrix with weights reflecting the number of times a concept has been mentioned by an actor (i.e. keeping the cell values of the two-mode matrix from NVivo, see the first point above). In this case, one could use the cosine normalization measure. The similarity measure between two codes calculated by the cosine normalization represents how often two non-normalized vectors showed a similar (or even the same) relative number of mentions of the two codes over all the different elements of the associating variable. Relative means here that the occurrences of each code across the elements of the associating variable are divided by the total sum of mentioning of these codes across the whole text selection. This way similarity between two codes is not dependent on how often the code occurred in the text selection. The number ranges from 0 to 1. For instance, in a one-mode concept network, the cosine normalization between two codes would be 1, if each of the codes was mentioned by each actor exactly the same number of times, relative to the overall mentioning of each concept.
Bundled R-scripts
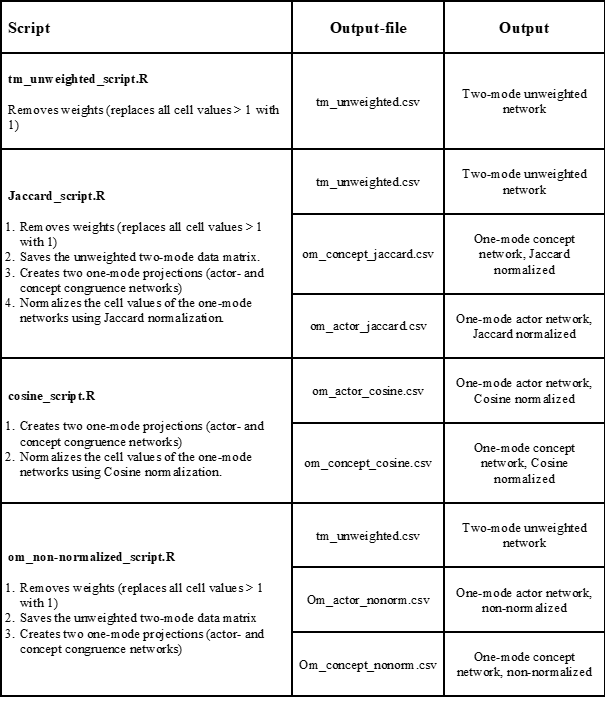
To achieve some of the most common desired output matrices that can be visualized in Visone, we have constructed a set of R-scripts that bundles the aforementioned transformations so that the NVivo output matrix is transformed to the desired one- or two-mode matrix (see the next section for an introduction of how to use the scripts). In the table below, we have summarized the scripts available in the File repository, what steps they perform and their output. For all scripts, the input is the two-mode data matrix exported from NVivo (see Chapter 3).
Using R to transform the matrix
Installing the necessary R-packages
This part of the guide describes in detail the steps most users will have to take in order to prepare R (install packages) and run scripts. It is not meant to be an introduction to R and you might encounter problems not covered in this short instruction.
Start by opening RStudio and run the following commands by copy-pasting them into the console and press enter (individually line-by-line). This will install the necessary packages needed to run the scripts. This only has to be done once.
install.packages("igraph")
install.packages(“ade4”)
install.packages(“lsa”)
Do not worry if a few error messages appear (you will soon know whether or not the scripts will run and thus if the installation has been successful).
Running the scripts
Continue by downloading the relevant script from the file repository. In this example, we will illustrate the process using the Jaccard script (jaccard_script.R) but the process is virtually identical with the cosine-script (only the output differs – see below).
Load the script by clicking File – Open file in RStudio, locate the jaccard_script.R file and press enter. The script opens in a new tab.
The script contains a series of command that will do the necessary transformations. Each command has been commented, indicated by the # character. The comments contain information about each command and what it does, which makes it possible for you to adapt the script (if you do, we are interested in knowing how and why).
The only required additions to the script are the following:
- Add the directory-path to your working directory by replacing the … in the top row (keep the citation marks). This is the directory where the output files will be saved (e.g. “C:/folder/folder”). Note that R requires you to use / and not \ when writing the directory path!
- Under the comment “# Loading two-mode matrix with edge weights into matrix object” you will see the attribute sep = “;”. This indicates that the CSV-files you created in Chapter 4 use semicolon as the separator. This is the standard option on most systems, but in UK/US versions of the operating system it might be that CSV-files are separated by commas, and this means you have to change this accordingly. To check what separator your CSV-file is using, simply open the file in Notepad.
When you have made the necessary modifications, you can run the script. This is done by selecting all rows (Ctrl-A) and pressing Ctrl-Enter. This will run all selected lines of code. A dialogue box will appear, where you should select the two-mode matrix from NVivo (see Chapter 4). The script should run without any errors appearing in the console. The outputs, in terms of CSV-files, will appear in the working directory set in the first line of code. You will also see that R produces a heatmap of the links between actors and concepts, in the bottom right corner.
Output-files
See above for a summary of the output-files from the different scripts.
References
Lesch, D. (2022) The Role of Global Actors in Sustainability Transitions – Exploring a Change Vehicle Trajectory in the Water and Sanitation Sector. MSc, Lund University, Lund.
In the script for the unweighted two-mode network some errors result from the omission of proper quotation marks or assignment operators. The correct version of the scripts is:
setwd(” “) #insert your work directory
library (igraph) #for network analysis
# Load matrix from csv
M = as.matrix(read.csv(file.choose(), sep = “;”, header = T, row.names = 1, check.names=FALSE))
#Transform into an unweighted, directed, twomode igraph object (Jaccard works best with unweighted binary matrices)
two_mode_network <- graph.incidence(M, directed = TRUE, mode = "out", weighted = NULL)
# Delete isolates from the twomode network (optional)
Isolated <- which(degree(two_mode_network)==0)
two_mode_network_ni <- delete.vertices(two_mode_network, Isolated)
class(two_mode_network_ni)
# Transform twomode back to an incidence matrix
M2 <- as_incidence_matrix(two_mode_network_ni, names = TRUE)
write.table(M2, file = "tm_unweighted.csv", dec = ".", sep = ";", col.names = NA)
#end of script
Do make sure to adapt the separator for the imported csv file depending on the format of your csv file.
Yes, that’s correct. There should be quotation marks around the work directory path. Thanks for pointing this out.
setwd("...")Also remember to write the path with \ and not /