Contributors to this chapter: Jonas Heiberg, Bernhard Truffer & Johan Miörner
In this chapter, we give a brief introduction to clustering using R and Visone.
Clustering might be useful in the context of an STCA in order to identify coherent subgroups of actors or concepts. While the network layout algorithms of Visone already depict similarities between nodes, identifying coherent groups of actors is often not entirely coherent, due to the necessities of multi-dimensional scaling algorithms to represent the n-dimensional network structures in two-dimensional space. The cluster algorithms discussed here, are optimized to identify groups of nodes that have a high internal similarity within and a maximized dissimilarity across the different groups. The results of the clustering process will generate an attribute variable associating each node with its best fitting cluster number and this cluster number may then be used to color the respective nodes.
Clear clusters of concepts may indicate coherent socio-technical configurations. Clusters of actors in turn may indicate the presence of similarly minded groups of actor. An interesting feature of clusters is that they can be analyzed regarding their internal composition. For example, in Heiberg and Truffer (2022), we identified clusters of actors based on their association with institutional logics in a particular field. We then analyzed the distribution and frequencies of different logics within each cluster helping us to reconstruct larger meaning structures within the field.
Prerequisites: Installation of R and RStudio. For free downloads: download R and download RStudio. Installation of Visone. Installation of java. There are various clustering methods applicable to network data. The purpose of this guide is to give an overview over how to implement two different clustering methods but won’t extend on the pros and cons nor on the implications of choosing any particular clustering method. These discussion would be beyond the scope of this guide.
Example 1: Hierarchical clustering (R)
To apply a simple hierarchical clustering algorithm open RStudio and run the ‘clustering_ward_script.R’. The script calculates clusters based on the ward method, which is an agglomerative clustering algorithm. It starts by considering each individual node as a different cluster and then iteratively merges organizations into higher level clusters by minimizing the squared distance of any point within a newly merged cluster from the centroid of the cluster, compared to the squared distances from the centroid of any other potential cluster merger (see Murtagh and Legendre, 2014 for its implementation in R).
As an import file you should often use a normalized one-mode actor- or concept network. However, the algorithm uses the cell values of the matrix as a basis, which means that using the ward algorithm clusters can be constructed e.g. based on the Jaccard index.
An important feature of clustering is defining a cut value at which the clustering iteration should be stopped, that is, the number of clusters that the algorithm shall identify. In the script, you can play around with different cut values by changing the k-value in
rec.hclust(cc, k = 10, border purple)The default is set to 10, which means that the 10 clusters will be defined in the dendogram plot in R. After deciding upon a cut value for your analysis, you can simply adjust the k-value also in the bottom two lines, which are also set to 10 by default. This can be done by replacing the 10s in code with the number of clusters targeted.
cut10 <- cutree(cc, k = 10)
write.table (cut10, file ="hclust_10.csv", dec = ".", sep = ";")
Note that the output will be a csv-file called ‘hclust_xyz.csv’, which will be saved to your work directory. You can rename the file by adjusting it in the script. It contains every node (e.g. actors or concepts) in the first column and numbers representing the cluster that each node has been assigned to.
The csv file can be treated as an attribute file to change the color or shape of the nodes in visone (see chapter 4).
Example 2: Louvain clustering (R & Visone)
A more complicated clustering method that is, however, widely used by network analysts is the Louvain method. Put simply, it seeks to optimize a measure called modularity in an iterative processes in which nodes are being connected into clusters. Modularity thereby measures the density of connection within clusters compared to the density of connections between clusters (Blondel et al., 2008). For a more detailed introduction to applying Louvain clustering in R see also R-bloggers (2020).
Louvain clustering can be implemented via R and also directly in visone.
In R, you can run the script ‘clustering_louvain_script.R’. Again, as an input use the normalized one-mode network of the mode you are interested in. The Louvain method finds an optimal number of clusters itself. No cut value needs to be defined.
The output file louvain.csv can be appended to visone as an attribute file (see Chapter 4).
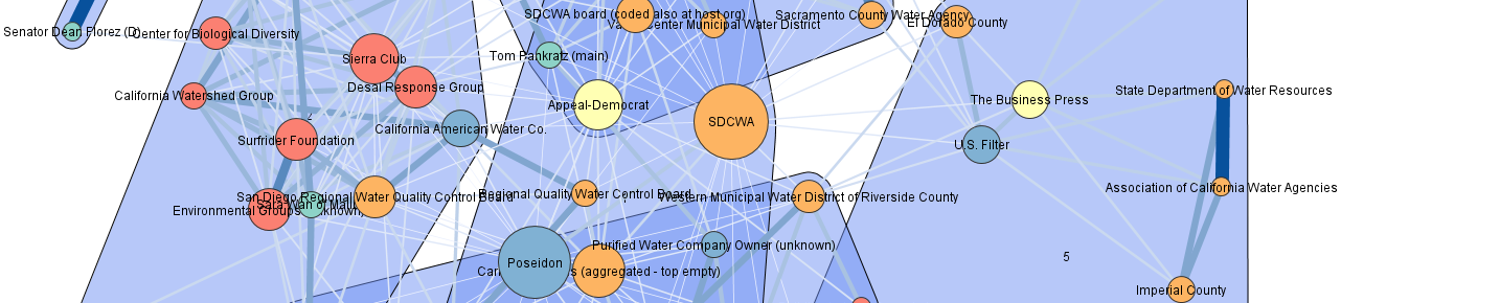
Alternatively, Louvain is also implemented in Visone directly. Go to analysis, task: grouping, class: clustering, measure: modularity, method: Louvain. An interesting option is to check the box ‘create group nodes’. It will result in polygons around every cluster in the network. Be sure to use the ‘result in: new tab’ function before clicking on analyze. If you keep the ‘create group nodes’ unchecked, you will find the cluster numbers as attributes in the attribute manager. You can then use them to color or shape your nodes in the network.
References
Blondel, V. D., Guillaume, J.-L., Lambiotte, R. and Lefebvre, E. (2008) ‘Fast unfolding of communities in large networks’, Journal of Statistical Mechanics: Theory and Experiment.
Heiberg, J. and Truffer, B. (2022) ‘Overcoming the harmony fallacy: How values shape the course of innovation systems’, Environmental Innovation and Societal Transitions, 42, pp. 411-428.
Murtagh, F. and Legendre, P. (2014) ‘Ward’s Hierarchical Agglomerative Clustering Method: Which Algorithms Implement Ward’s Criterion?’, Journal of Classification, 31(3), pp. 274-295.
R-bloggers (2020) Community Detection with Louvain and Infomap. Available at: https://www.r-bloggers.com/2020/03/community-detection-with-louvain-and-infomap/. (accessed: 19.01.2022)